
Read the scale
Confirm baseline, intervals, units, and breaks.
Chart OCR reconstructs visible labels and plotted values into a table for review. It works best when values are printed on the chart; estimating values from an unlabeled axis remains approximate and must be checked against the original scale.
Values printed on the chart are stronger than values inferred from a scale. Mark estimates and verify every series against the legend.
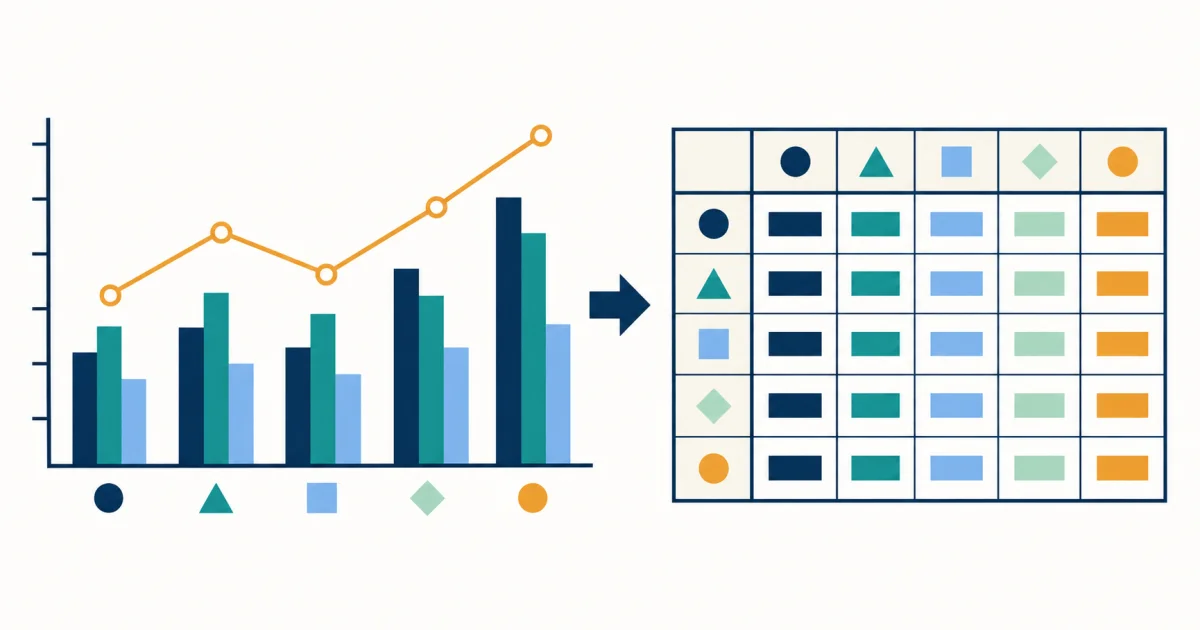
The chart supplies categories, series, and a scale. The result separates those elements into cells so the reviewer can see which values were read directly and which remain uncertain.
Use this tool when a chart contains data labels or a clear axis that can support a transparent reconstruction. Title, units, axes, legend, categories, and values all contribute to the table. Removing one can change the meaning of every number.
Confirm baseline, intervals, units, and breaks.
Match color, symbol, or pattern to its legend label.
Separate printed values from visual estimates.
Data labels can support direct transcription. Unlabeled points between grid lines support only estimates, especially after resizing or perspective distortion.
A tight crop can remove units, series names, the zero baseline, or scale breaks.
A photographed chart should be square to the page so the scale remains consistent.
Keep printed values distinct from values inferred between grid lines.
Confirm whether labels describe each segment, the cumulative height, or the total.
A nonzero baseline can exaggerate small differences, so preserve and record the displayed minimum before reconstructing any value.
Apply the cell-checking approach from A Field-First OCR Workflow for Receipts, Invoices, and Tables.
For structured values and source checking, continue with the table and visual-data review guides.
Simple bar, line, and pie charts with visible labels, legends, units, or data values.
Interpreting causation, validating statistics, or recovering exact unlabeled values from decorative charts.
Axis scale, units, legend mapping, stacked segments, negative values, and inferred points.
No. Exact recovery requires visible labels or a sufficiently clear scale. Otherwise the output is an estimate. Read the extraction limits.
No. It reconstructs visible data and labels; interpretation, causation, and statistical validity remain separate tasks. Choose the right review level.